
You cannot solve a problem unless you know its root cause. First, you have to factor all possible causes that created the problem, and then think of the solution(s). Finding the “main culprit” is critical if you don’t want the problem to resurface.
While you may try different problem-solving techniques, Ishikawa or fishbone diagram is one of the best tools. It does not only help to identify the reasons for failures and variations, but also helps to solve the problem.
What is a Fishbone Diagram?
It goes by different names, such as Ishikawa diagrams, Herringbone diagrams, and Cause and Effect diagram, but the Fishbone diagram is a visual tool for analyzing the potential causes of a problem.
Ishikawa aka Fishbone diagram
Dr. Karou Ishikawa, a Japanese quality control expert, devised the cause and effect analysis in the 1960s.

Cause and Effect
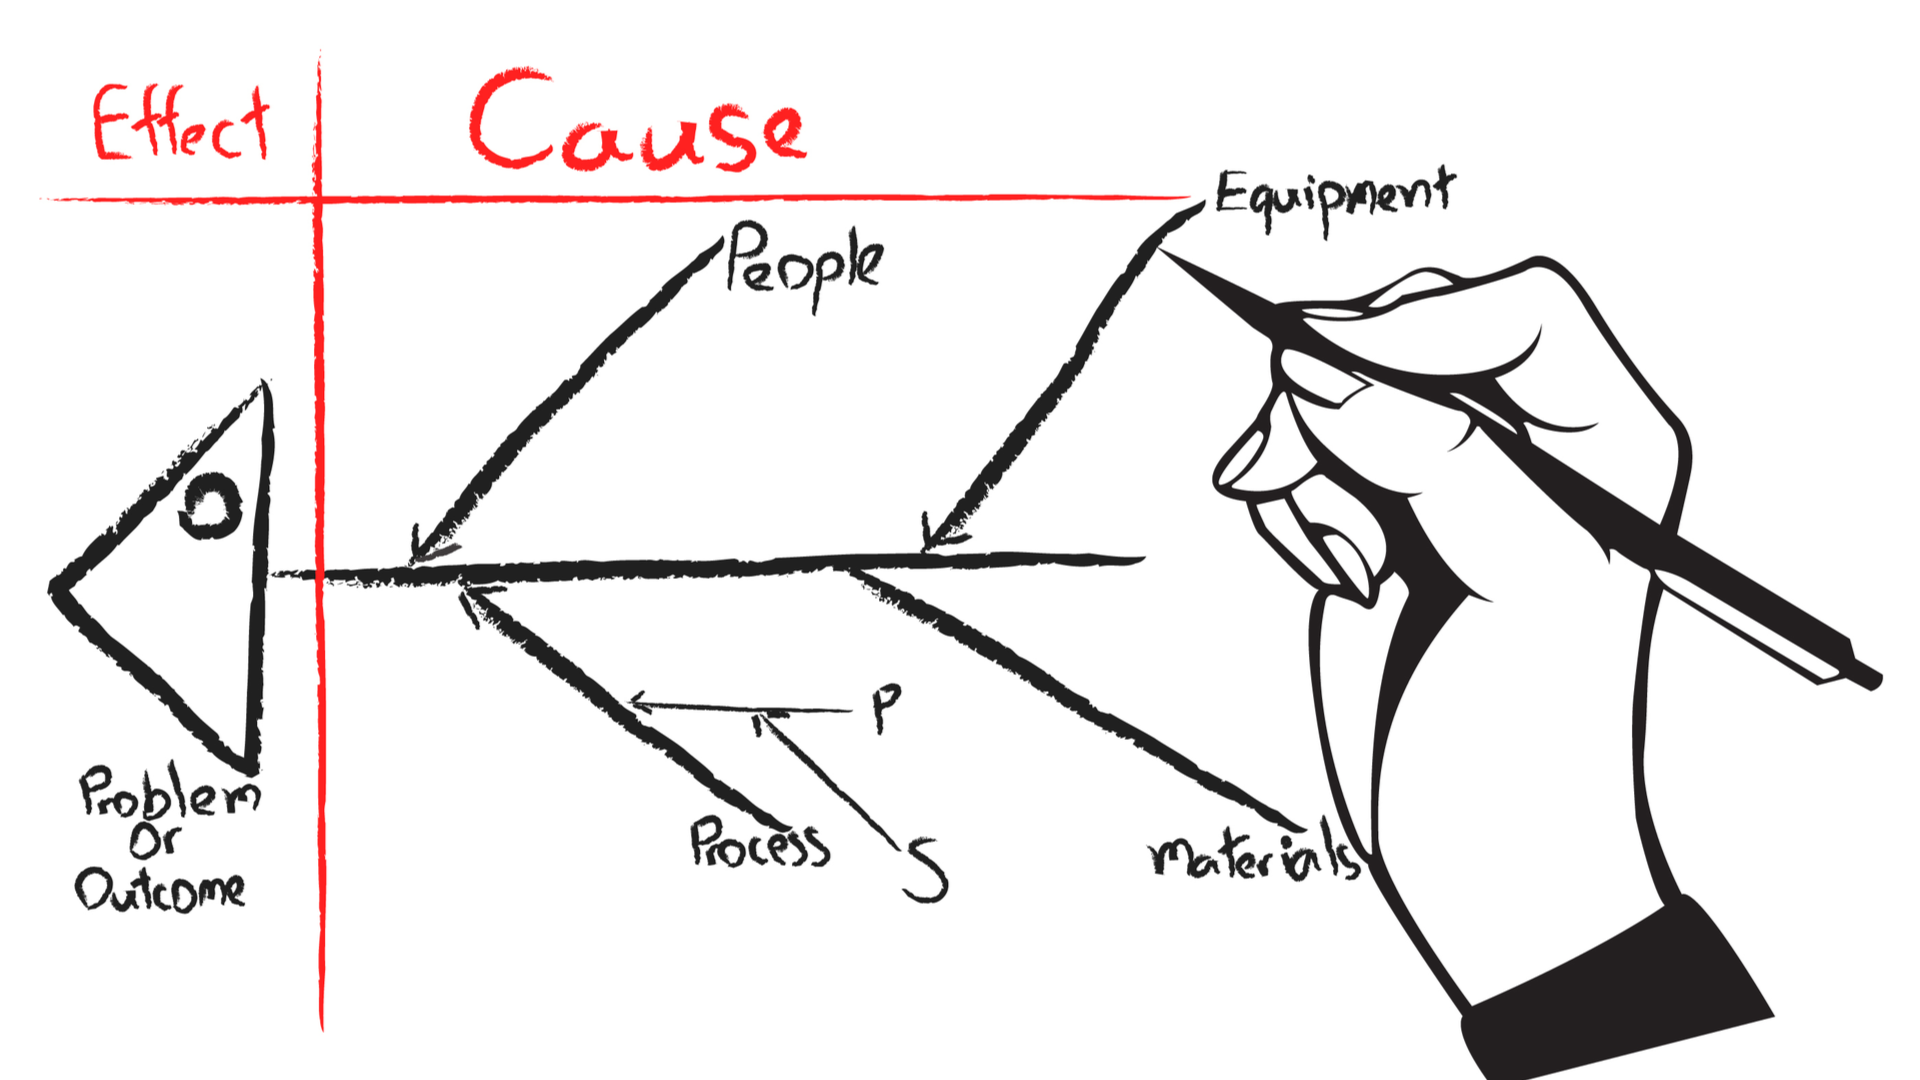
He included the technique in his book “Introduction to Quality Control,” published in 1990. The cause and effect diagram tracks down the reasons for defects and imperfections. The diagram resembles a fish skeleton with the effect (problem) at its head and the causes feeding into the spine.
Once you have identified the problems, you can start looking for immediate and long-term solutions. Fishbone diagram is a root cause analysis tool that involves brainstorming with mind map template. It helps employees in addressing and solving the root causes of the existing problem.
Uses of Fishbone Diagram
Fishbone is a diagram-based approach for identifying and solving all possible causes of a problem. Essentially developed as a quality control tool, a fishbone diagram helps in many others. For instance, you can use the Ishikawa diagram for:
- Identifying all possible causes of a problem
- Developing a product for addressing issues within the current market
- Avoiding employee burnout
- Uncovering bottlenecks in your business
- Taking the right actions to solve the issue
- Getting out of the rut
How to Use the Fishbone Diagram?
You can draw the diagram either on a whiteboard or flipchart during the meeting. The technique involves the following steps.
1. Identify the main Problem
The first step is to identify the exact problem; use the 5Ws+1H technique. Write down what, where, when, why, and how the problem occurred. Write the problem in a statement format on the left side of the sheet and draw a box around it. Draw a horizontal arrow across the page with an arrow pointing to the head. The arrow acts as the backbone of the fish; use this space to develop ideas.
2. Consider the major Factors
Workout all major factors involved in the problem; you can divide the factors into categories using different models or use generic terms. For instance, you can consider
- 4Ps of Marketing (Product, Price, Place, and Promotions) or
- 5M model (Man, Machine, Methods, Material, and Measurement.
3. Brainstorm the possible Causes
Now, brainstorm potential causes related to the factors responsible for the problem. You can show the reasons as shorter lines that are coming off the “fish bones.” Break down the complex causes into sub-categories branching out of each cause.
4. Analyze the Diagram
Now that you have all the possible causes, analyze each of them and investigate related causes. Grouping the causes help you think through different elements.
Looking at the elements separately from the whole process helps you focus on the solutions. It makes the task less daunting and more manageable.
Your thoughts, please